
Urban Media Table
The National Building museum
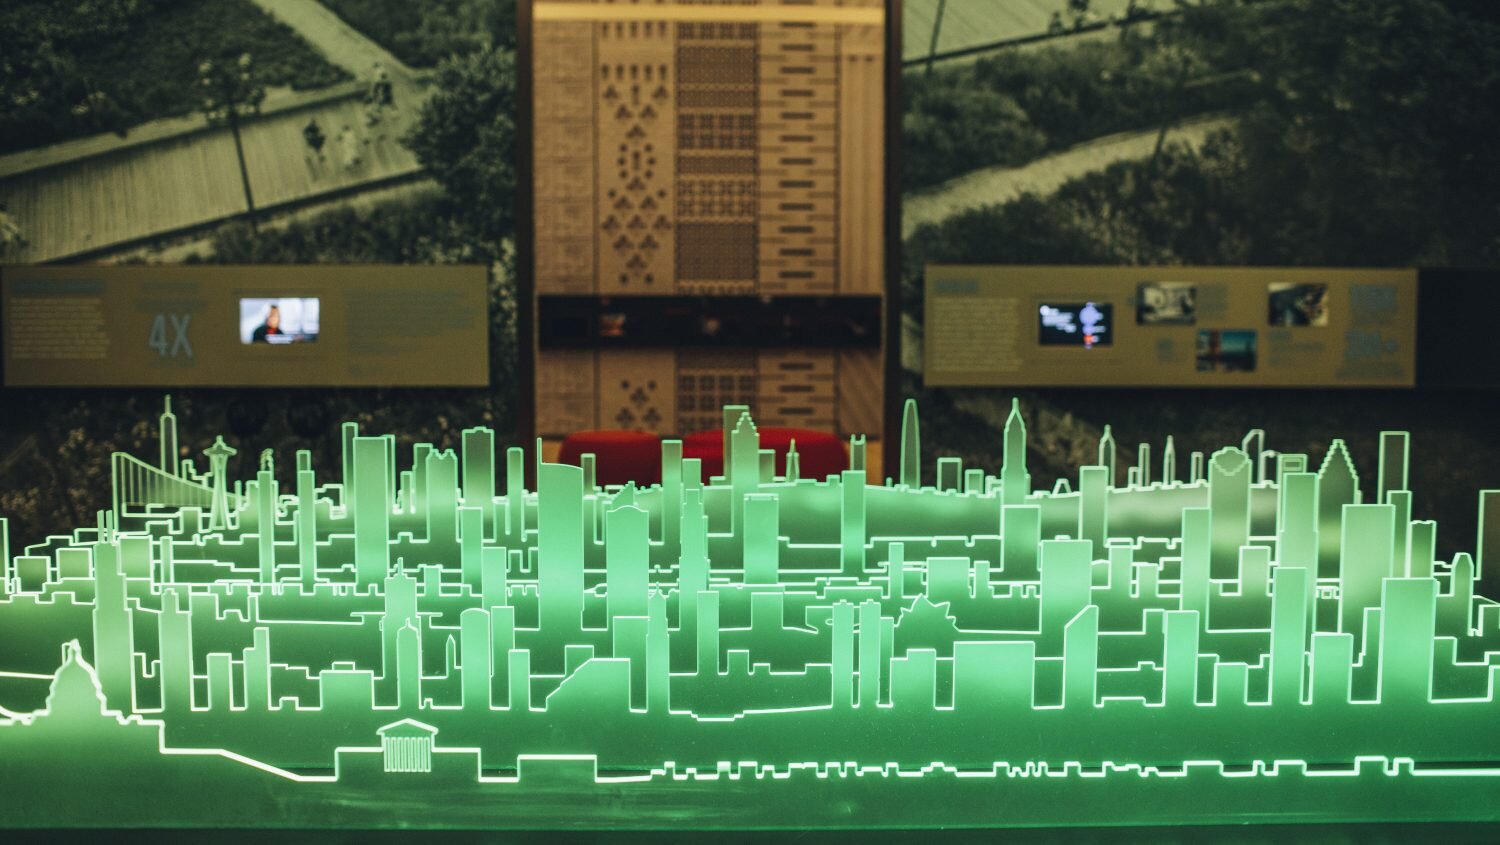
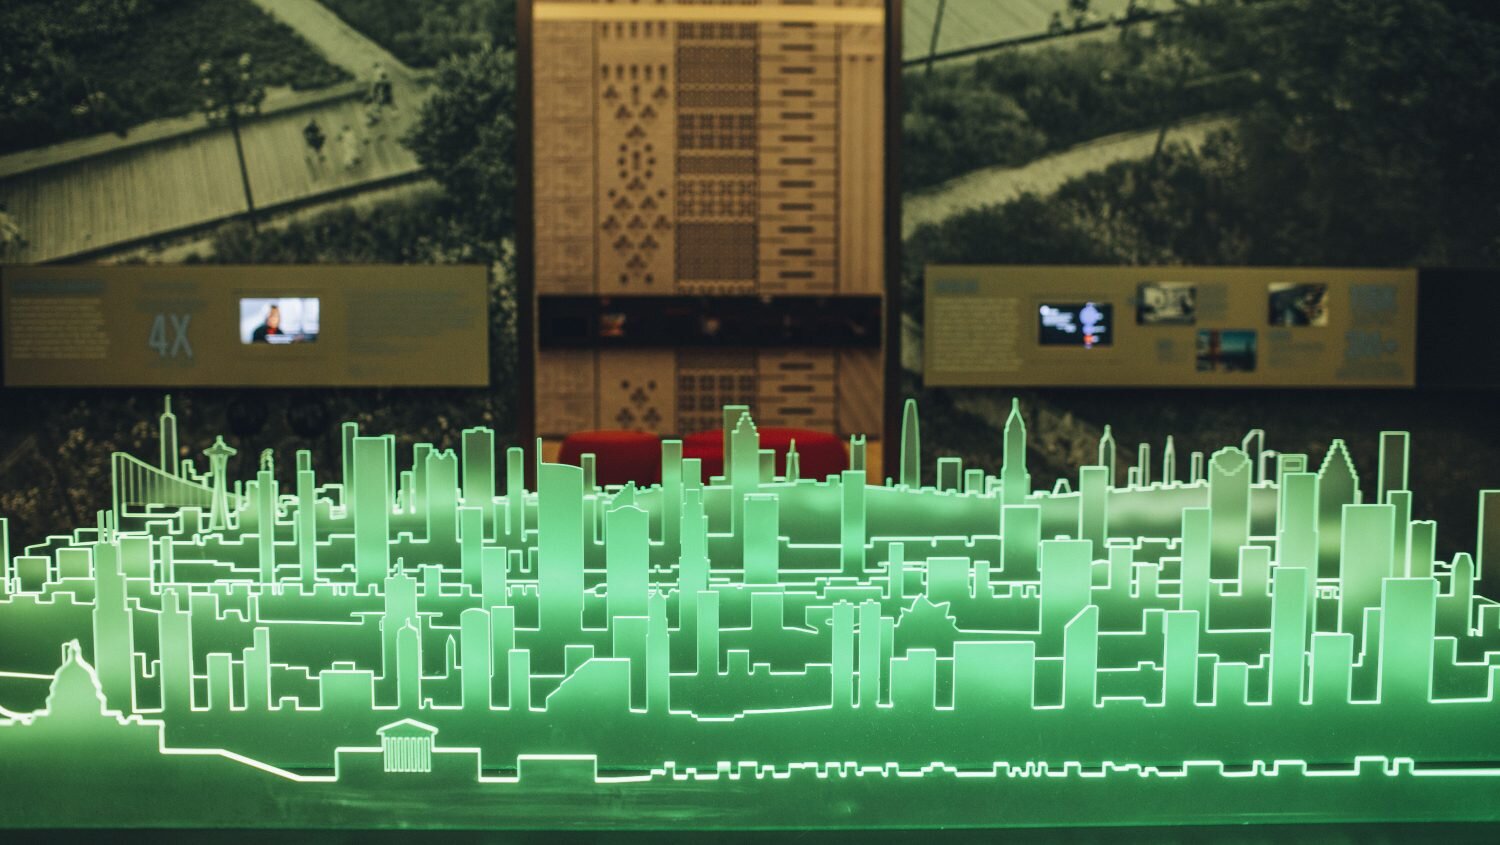
The Urban Media Table introduces visitors to the National Building Museum's big ideas about the built environment. Twelve laser-cut acrylic skylines line the table, each representing an American city, alongside two screens that bring the cities' data to life.
I was the lead software developer on the project, which was built entirely in TouchDesigner. The system pulled in data about each city, population, economics, transportation, housing, and the environment, and drove two synced outputs: the graphics on the table's two screens, and the color output mapped to addressable LED strips inside the acrylic skylines. Those LEDs turned the skylines themselves into physical bar graphs that lit up to match the story on screen.
Most of the work was building the system in TouchDesigner that ran the whole experience. It moved through a sequence of narrative slides, updating the two screens and the twelve skylines together so the data, the graphics, and the physical lighting always stayed in step. Each topic played out across the whole table at once: when the focus was population, every skyline lit up with its own data, letting visitors take in all twelve cities at a glance. For direct comparisons, the table kept two or three cities lit while dimming the rest, using light to pull the visitor's eye to the cities being highlighted.
From there, the color output was fed out to the acrylic skylines through an Advatek pixel controller driving the addressable LEDs, with the pixel mapping set so each city's data landed on the right strip.
Built in TouchDesigner. Created at Bluecadet.